How Exposed Kubernetes Dashboards Allow Full Cluster Takeover
An unauthenticated dashboard exposes the API server directly, granting an attacker immediate control over every workload and secret within the cluster without needing to exploit application code.
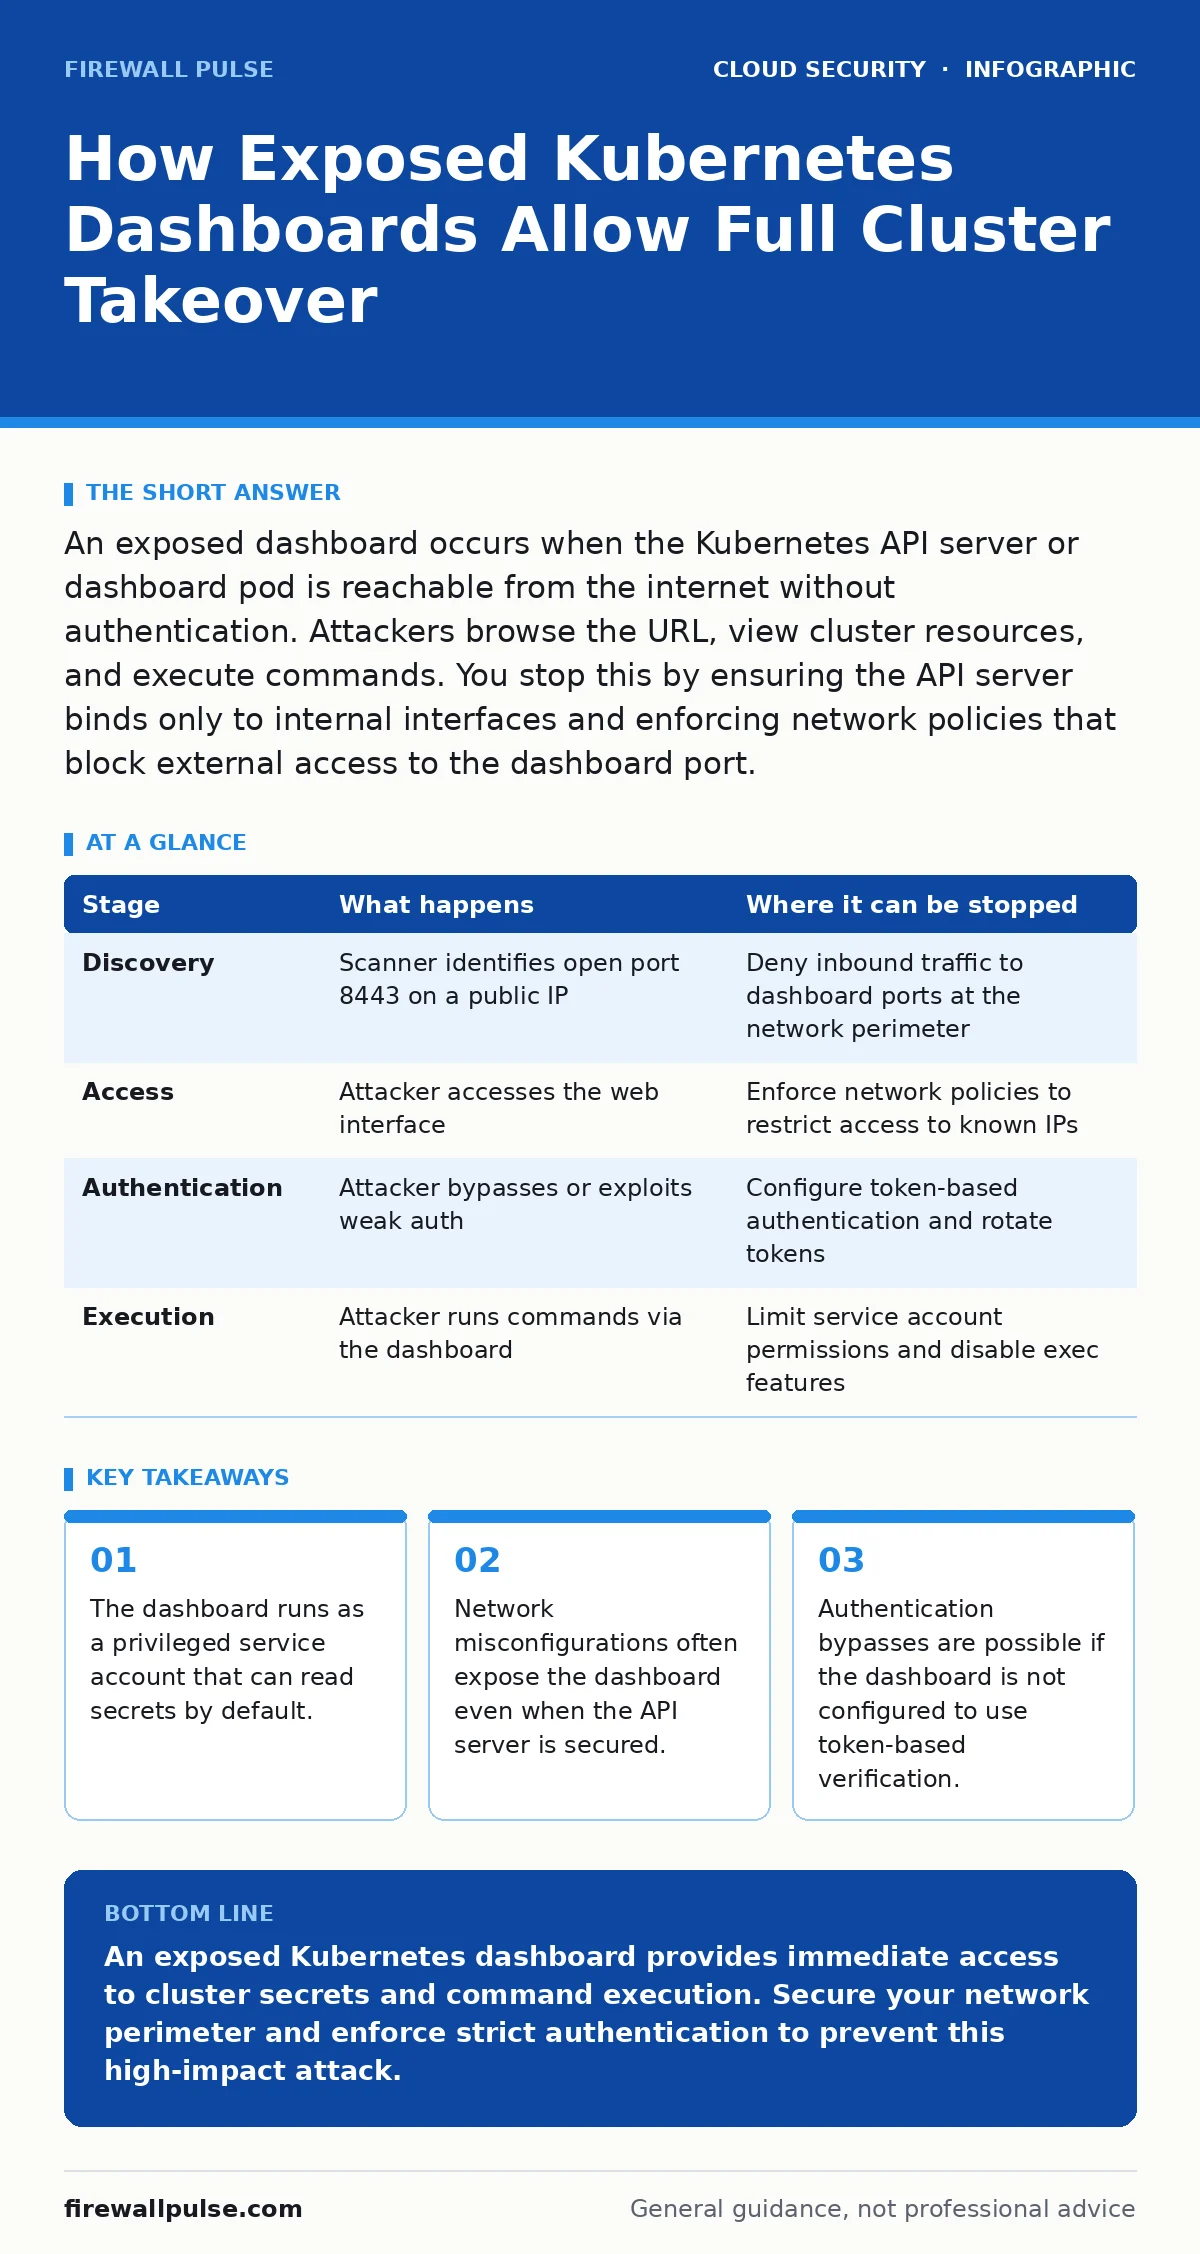
An exposed dashboard occurs when the Kubernetes API server or dashboard pod is reachable from the internet without authentication. Attackers browse the URL, view cluster resources, and execute commands. You stop this by ensuring the API server binds only to internal interfaces and enforcing network policies that block external access to the dashboard port.
The Architecture of Exposure
Kubernetes clusters rely on a central control plane to manage workloads. The Kubernetes Dashboard is a web-based user interface that allows operators to interact with this control plane. By design, it connects to the Kubernetes API server to retrieve data and execute commands. If this interface is accessible from the public internet, the security boundary of the entire cluster collapses.
The exposure rarely stems from a software bug in the dashboard itself. Instead, it results from infrastructure misconfiguration. The dashboard pod must be reachable by the user’s browser. This requires a network path from the internet to the pod’s port. If that path is open, and if the dashboard is not configured to require strong authentication, the cluster is compromised.
The Attack Surface
The dashboard listens on a specific port, typically 8443, for HTTPS traffic. It expects requests from users who have been authenticated by the Kubernetes API server. The dashboard does not handle authentication itself in most secure configurations. It relies on the API server to validate tokens. When this chain is broken, the dashboard becomes a direct gateway to the API.
Imagine a cluster deployed in a public cloud environment. The cloud provider assigns public IP addresses to nodes. If the firewall rules allow inbound traffic on port 8443, the dashboard is visible. The attacker does not need to guess passwords. They simply need to find the IP address and the open port. This is often achieved through automated scanning tools that crawl the internet for known Kubernetes endpoints.
### Stage 1: Discovery and Reconnaissance
The attacker begins by scanning IP ranges for open ports associated with Kubernetes components. Port 8443 is a common indicator of the Kubernetes Dashboard. Port 6443 indicates the API server. Scanners send probes to these ports and record any responses. A successful connection returns an HTTP status code, confirming the service is live.
This stage relies on the principle of least surprise. Many deployments assume that internal services are hidden by default. In public cloud environments, security groups or firewall rules must explicitly deny traffic. If the default rule allows all inbound traffic, the dashboard is exposed from the moment the cluster is created. The attacker gains no credentials at this stage, only knowledge that a target exists.
| Stage | What happens | Where it can be stopped |
|---|---|---|
| Discovery | Scanner identifies open port 8443 on a public IP | Deny inbound traffic to dashboard ports at the network perimeter |
| Access | Attacker accesses the web interface | Enforce network policies to restrict access to known IPs |
| Authentication | Attacker bypasses or exploits weak auth | Configure token-based authentication and rotate tokens |
| Execution | Attacker runs commands via the dashboard | Limit service account permissions and disable exec features |
### Stage 2: Interface Access
Once the port is confirmed open, the attacker visits the URL in a browser. The Kubernetes Dashboard presents a login screen. In a secure setup, this screen requires a bearer token or a certificate. However, many installations disable authentication for convenience during development or testing. If authentication is disabled, the attacker is immediately granted access to the dashboard interface.
Even if authentication is enabled, the dashboard may be misconfigured to accept any token. Some older versions or custom builds allow anonymous access if the configuration file is not set correctly. The attacker sees the cluster name, the number of nodes, and a list of namespaces. This information is sufficient to plan the next phase of the attack. The visual interface makes it easy to navigate the cluster structure without knowing the command line.
### Stage 3: Credential Harvesting
The dashboard runs as a service account. By default, this service account has broad permissions. It can list pods, view secrets, and describe services. Secrets in Kubernetes are base64-encoded data, such as database passwords, API keys, and TLS certificates. They are not encrypted by default at rest. The dashboard can display these secrets in plain text if the user has the necessary permissions.
The attacker navigates to the Secrets section of the dashboard. They click through various namespaces to find valuable credentials. This is where the exposure becomes critical. The attacker does not need to exploit a vulnerability in the application code. They simply read the data that the application needs to function. This includes credentials for cloud providers, which can lead to further compromise of the underlying infrastructure. See insecure cloud APIs for how these credentials can be abused once obtained.
See also: Implement Cloud Compliance: A Step-by-Step Guide for Secure Infrastructure
### Stage 4: Command Execution and Persistence
With credentials in hand, the attacker moves to execution. The Kubernetes Dashboard allows users to execute commands inside running containers. This feature, known as exec, is intended for debugging. It opens a shell session inside a pod. The attacker selects a running pod, opens a terminal, and gains command-line access.
From this shell, the attacker can install malware, pivot to other systems, or exfiltrate data. They can also create new service accounts with elevated privileges. This ensures persistence even if the dashboard is later secured. The attacker might also modify deployment configurations to run malicious containers. This stage relies on the principle that the dashboard’s service account has the ability to execute commands. If this permission is removed, the attack chain is broken. See workload identity for how to restrict what identities can execute commands.
### Stage 5: Lateral Movement
The initial compromise is just the beginning. The attacker uses the compromised cluster to move laterally. They access other namespaces, which may contain more sensitive workloads. They may also access the underlying cloud infrastructure if the nodes have attached IAM roles. These roles often have permissions to read storage, create new instances, or modify network rules.
This stage highlights the interconnected nature of cloud security. A breach in the container layer can escalate to the infrastructure layer. The attacker uses the credentials harvested in Stage 3 to access cloud services. They might create a new virtual machine to host a command-and-control server. This makes the attack harder to detect because the malicious traffic originates from a legitimate cloud resource. See overprivileged cloud identities for how to limit the impact of such escalations.
Interrupting the Attack Chain
The attack relies on three main weaknesses: network exposure, weak authentication, and excessive permissions. You can interrupt the chain at any of these points. The most effective measure is to ensure the dashboard is never exposed to the public internet. Use network policies to restrict access to specific IP addresses. If the dashboard is only accessible from a management network, scanners cannot find it.
Authentication must be enforced. Use token-based authentication and ensure that the dashboard validates tokens against the API server. Disable anonymous access. Regularly rotate tokens and service account keys. Finally, limit the permissions of the dashboard service account. It should only have the permissions necessary for viewing, not for executing commands or reading secrets. See cloud IAM policies for how to define least-privilege access.
Preventing Future Exposure
Prevention requires a combination of network security and configuration management. Use infrastructure-as-code tools to define firewall rules. Ensure that these rules are reviewed before deployment. Enable audit logging for the API server. This allows you to detect when the dashboard is accessed from unexpected sources. Monitor for attempts to list secrets or execute commands.
Regularly scan your cluster for misconfigurations. Use tools that check for open ports and exposed services. Ensure that the dashboard is updated to the latest version, which may include security patches. Consider removing the dashboard entirely if it is not needed. Many operators manage clusters via command-line tools, which are more secure and less prone to web-based attacks. See cloud compliance for how to automate these checks.
Key takeaways
- The dashboard runs as a privileged service account that can read secrets by default.
- Network misconfigurations often expose the dashboard even when the API server is secured.
- Authentication bypasses are possible if the dashboard is not configured to use token-based verification.
An exposed Kubernetes dashboard provides immediate access to cluster secrets and command execution. Secure your network perimeter and enforce strict authentication to prevent this high-impact attack.
Frequently asked questions
Can I secure the dashboard by adding a password?
Passwords are weak and often bypassed. Use token-based authentication and network restrictions instead.
Does exposing the API server directly cause the same risk?
Yes, but the dashboard makes it easier for attackers to navigate and execute commands without knowing the API syntax.
How do I know if my dashboard is exposed?
Scan your public IP addresses for open port 8443. If it responds, it is likely exposed.
Should I remove the Kubernetes Dashboard?
If you do not need a web interface, removing it eliminates the attack surface entirely.
How this guide was produced: written by the Firewall Pulse editorial team with AI assistance, checked against the public references listed below, and reviewed when the facts change. See our editorial policy or report an error.